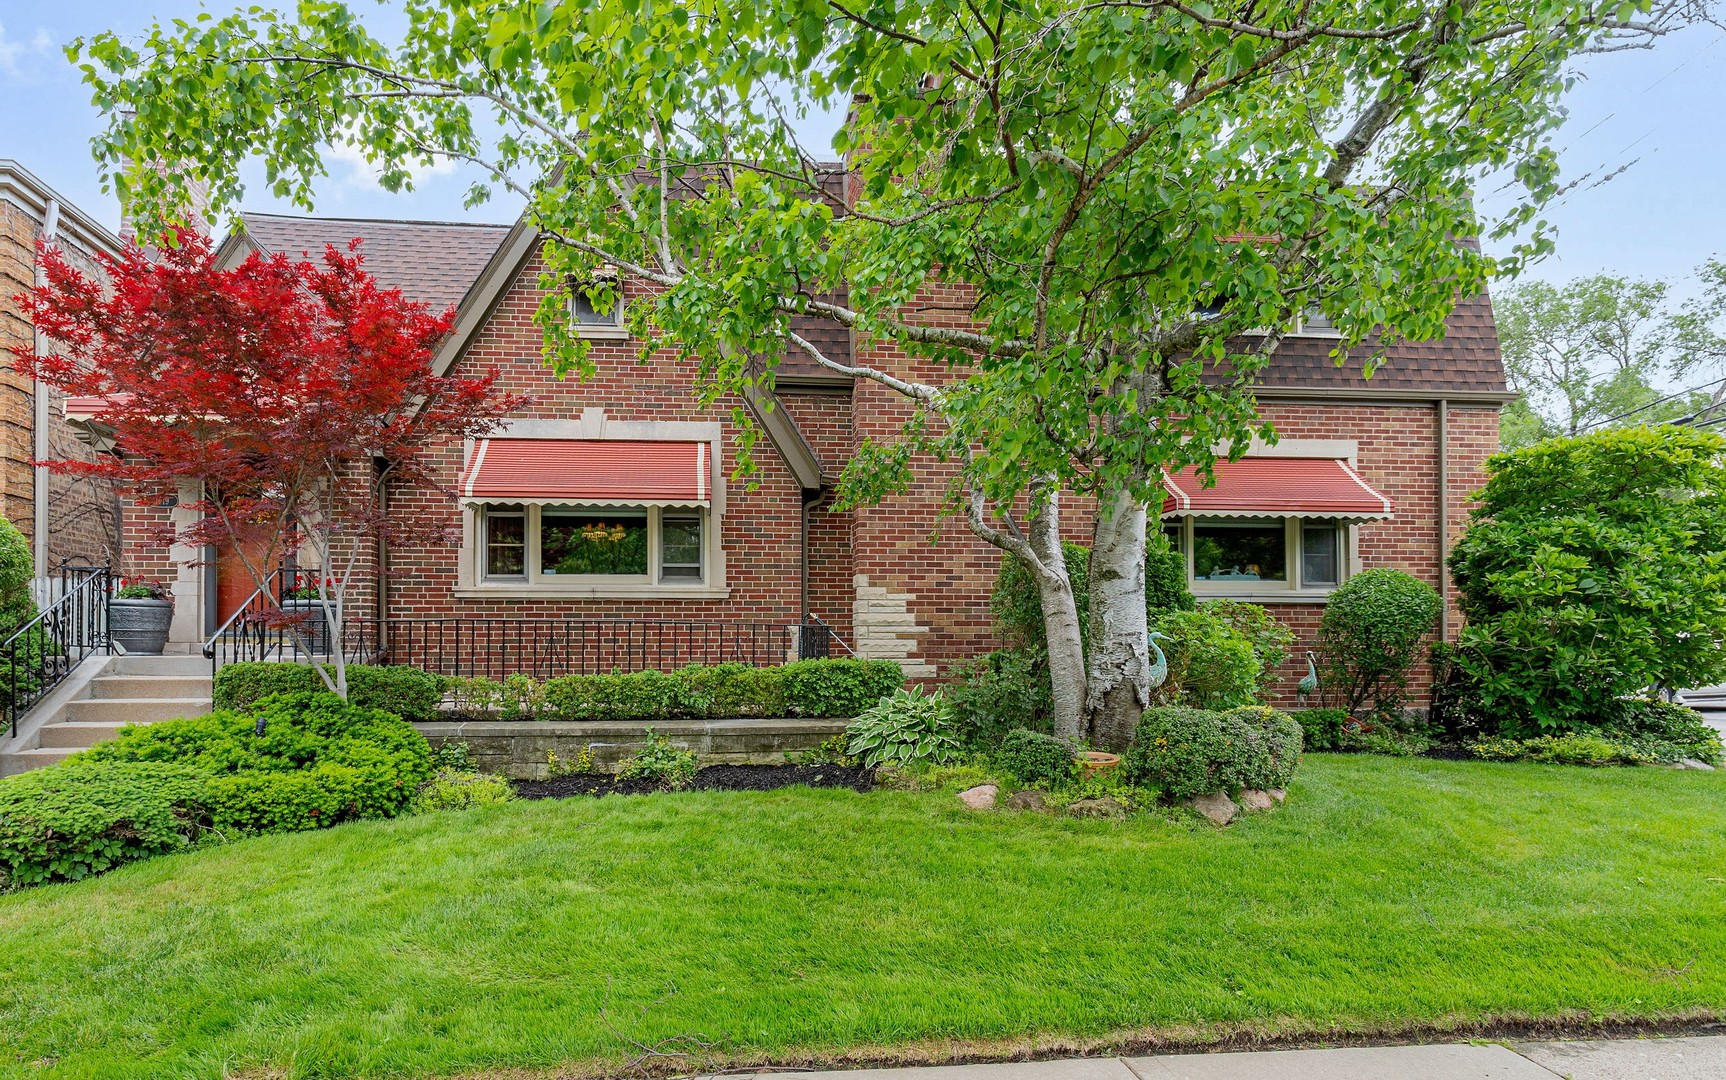
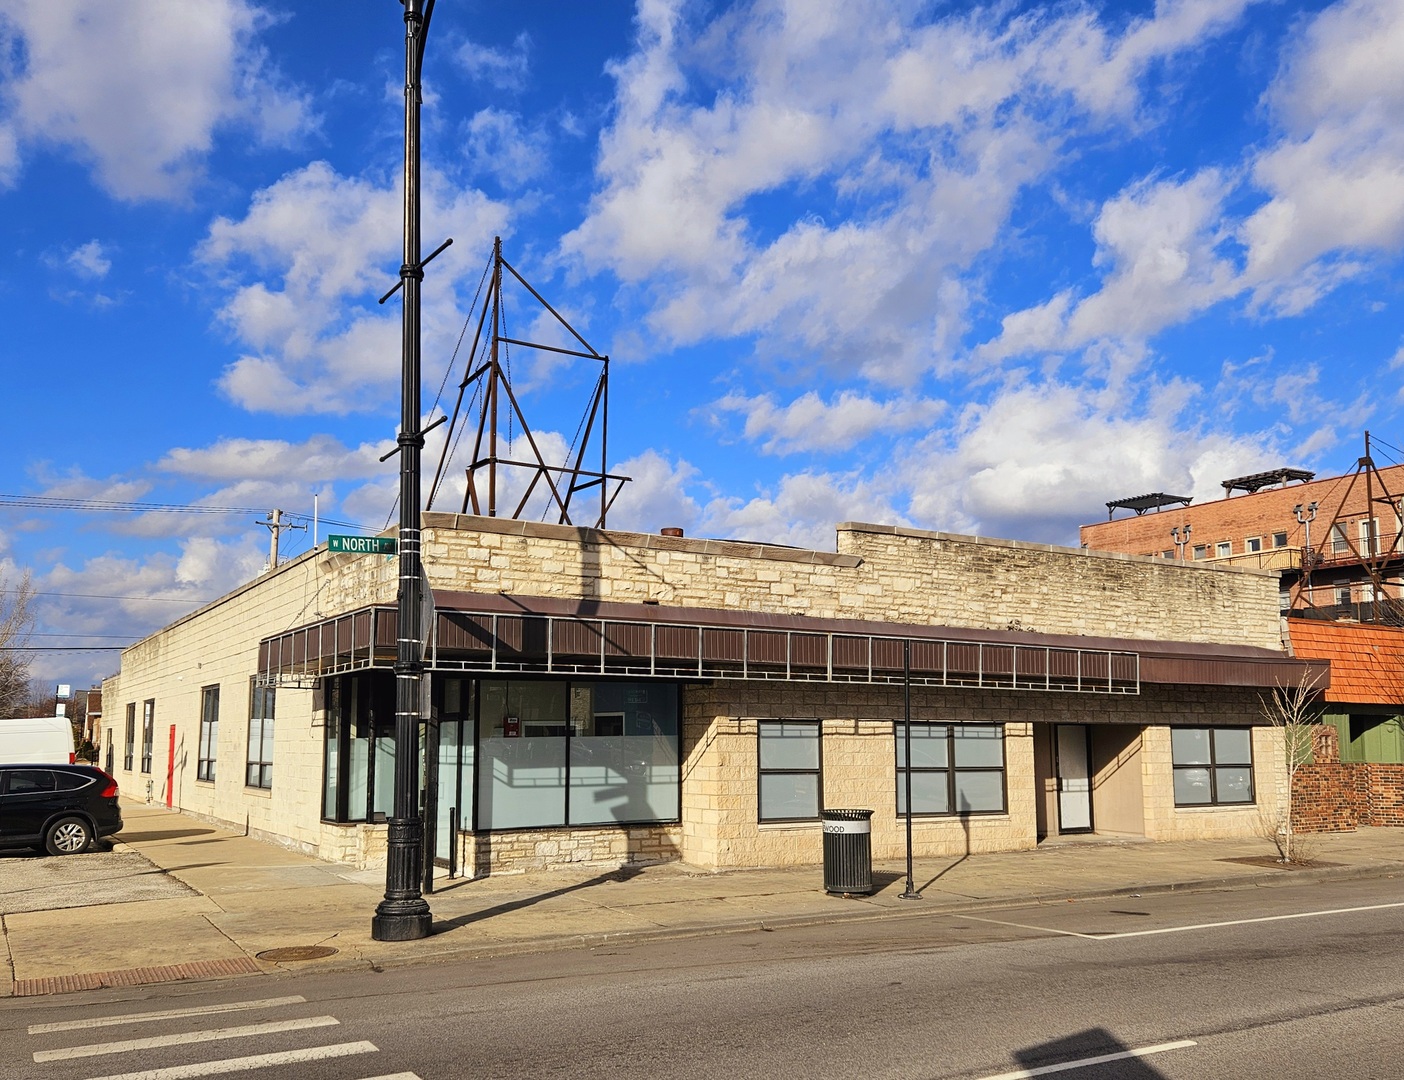
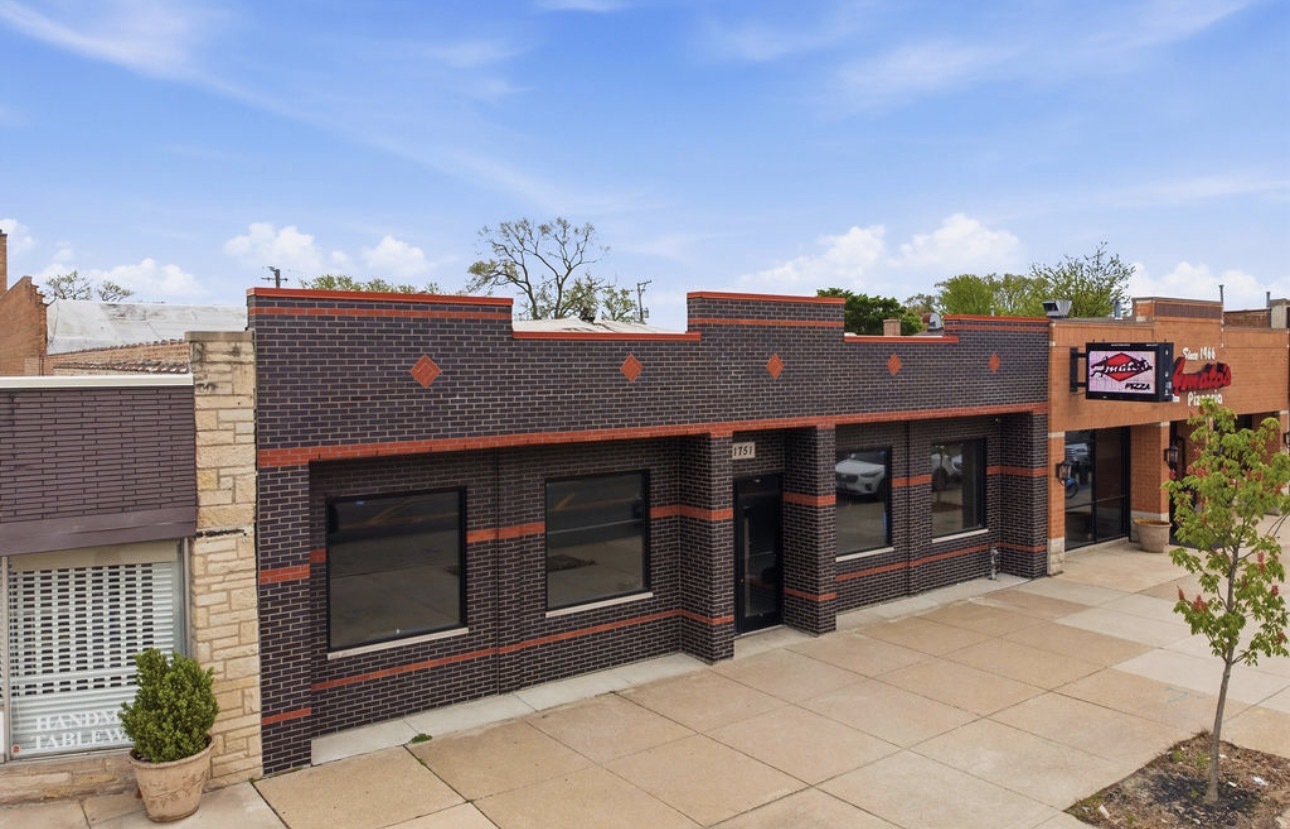
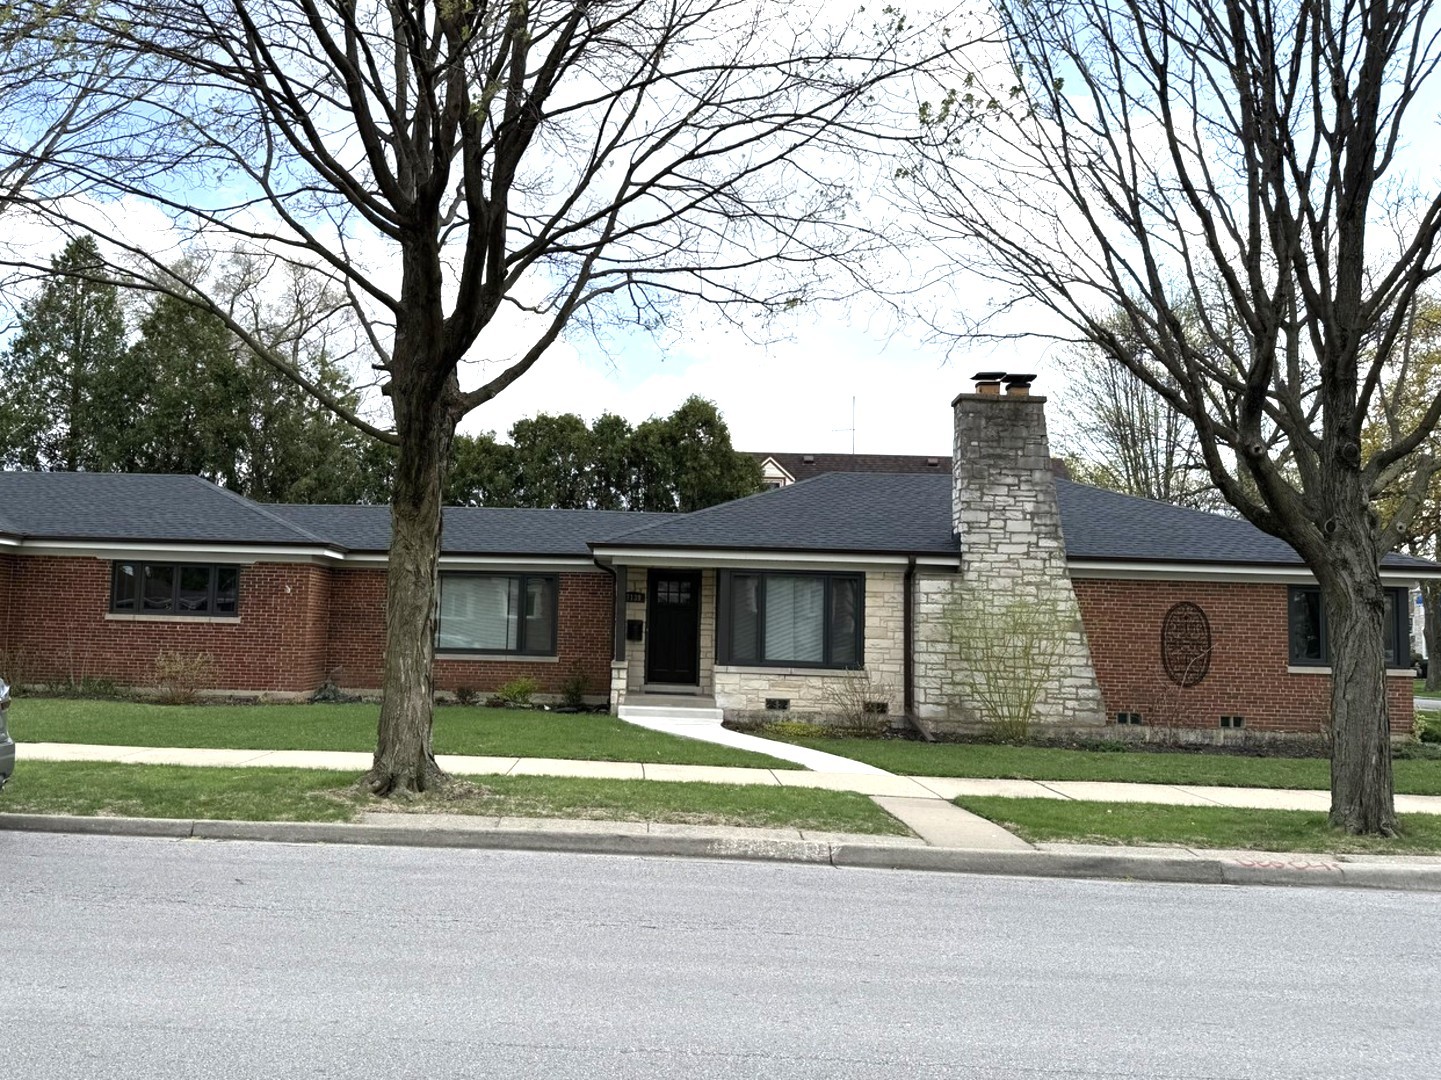
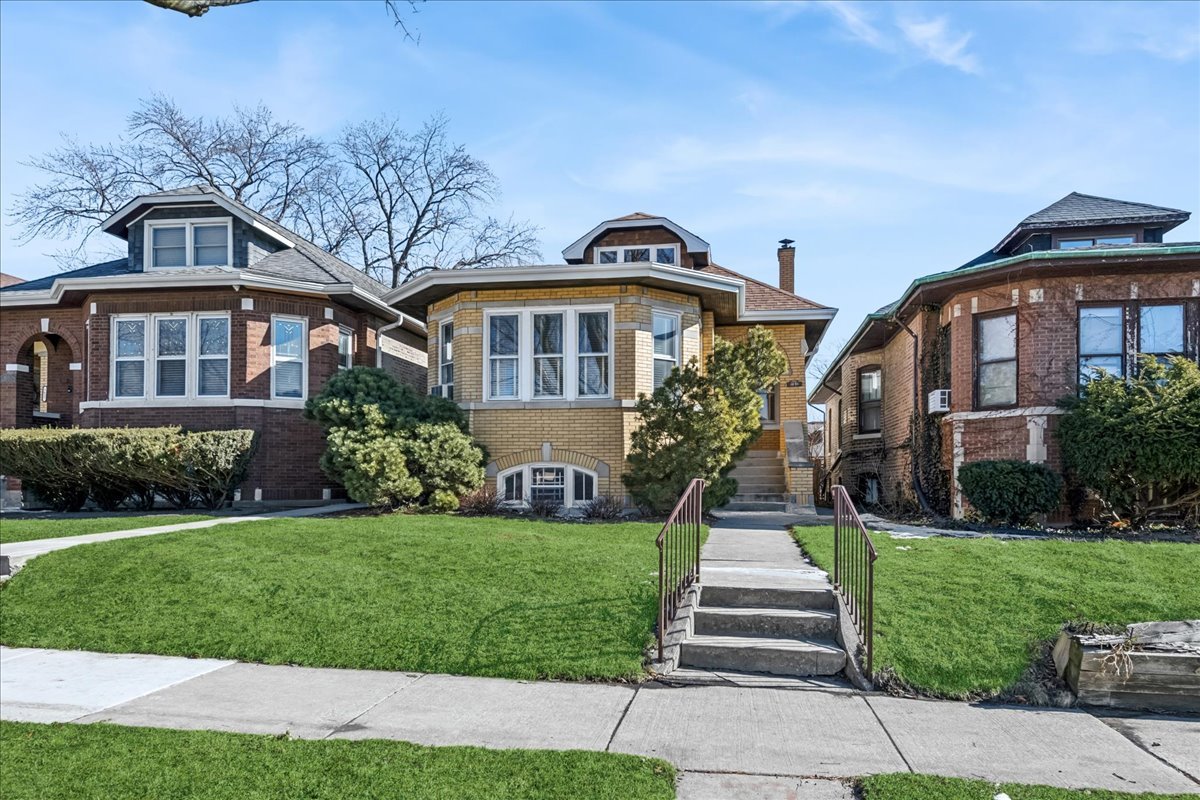
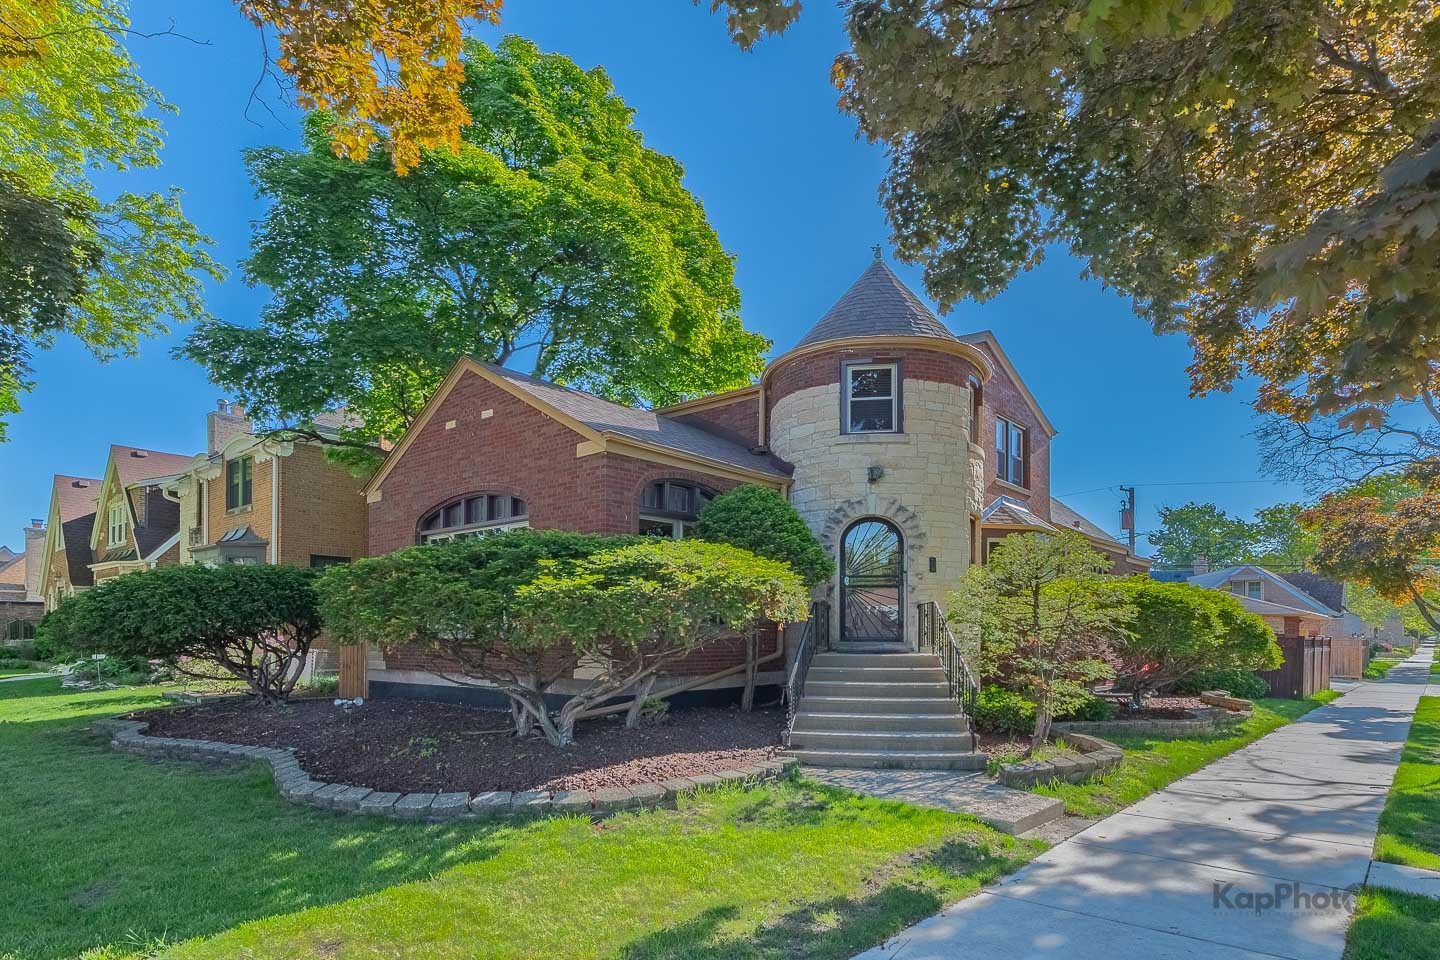
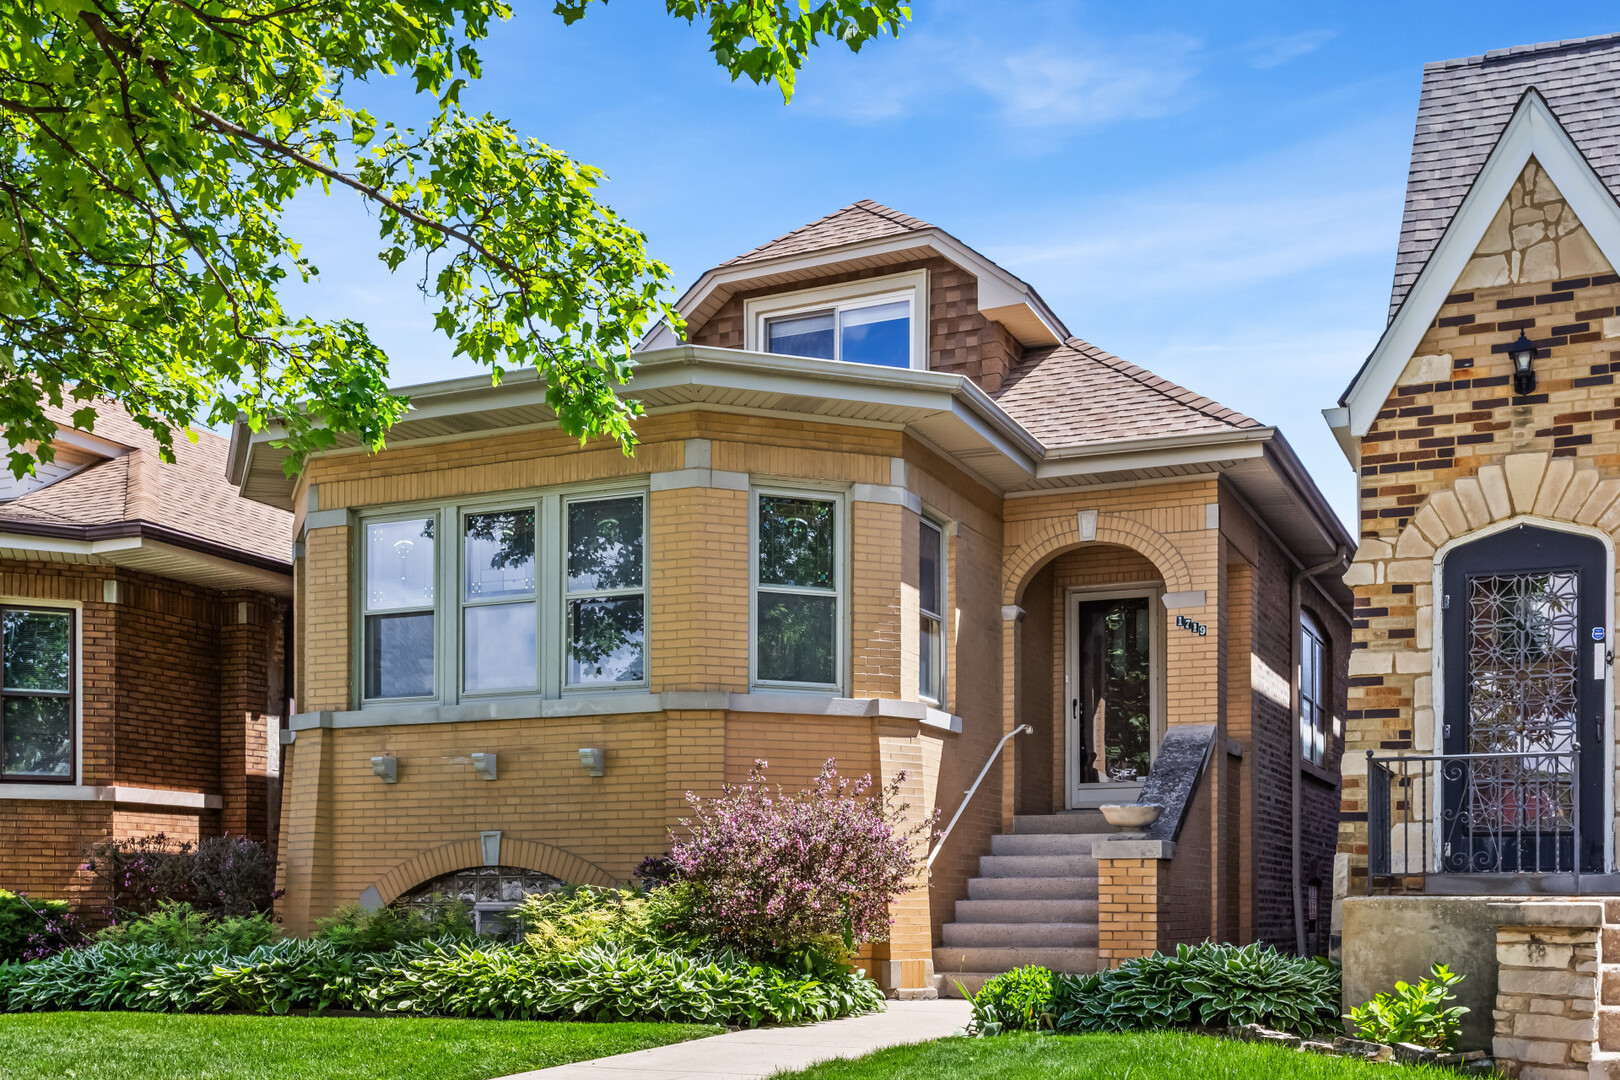
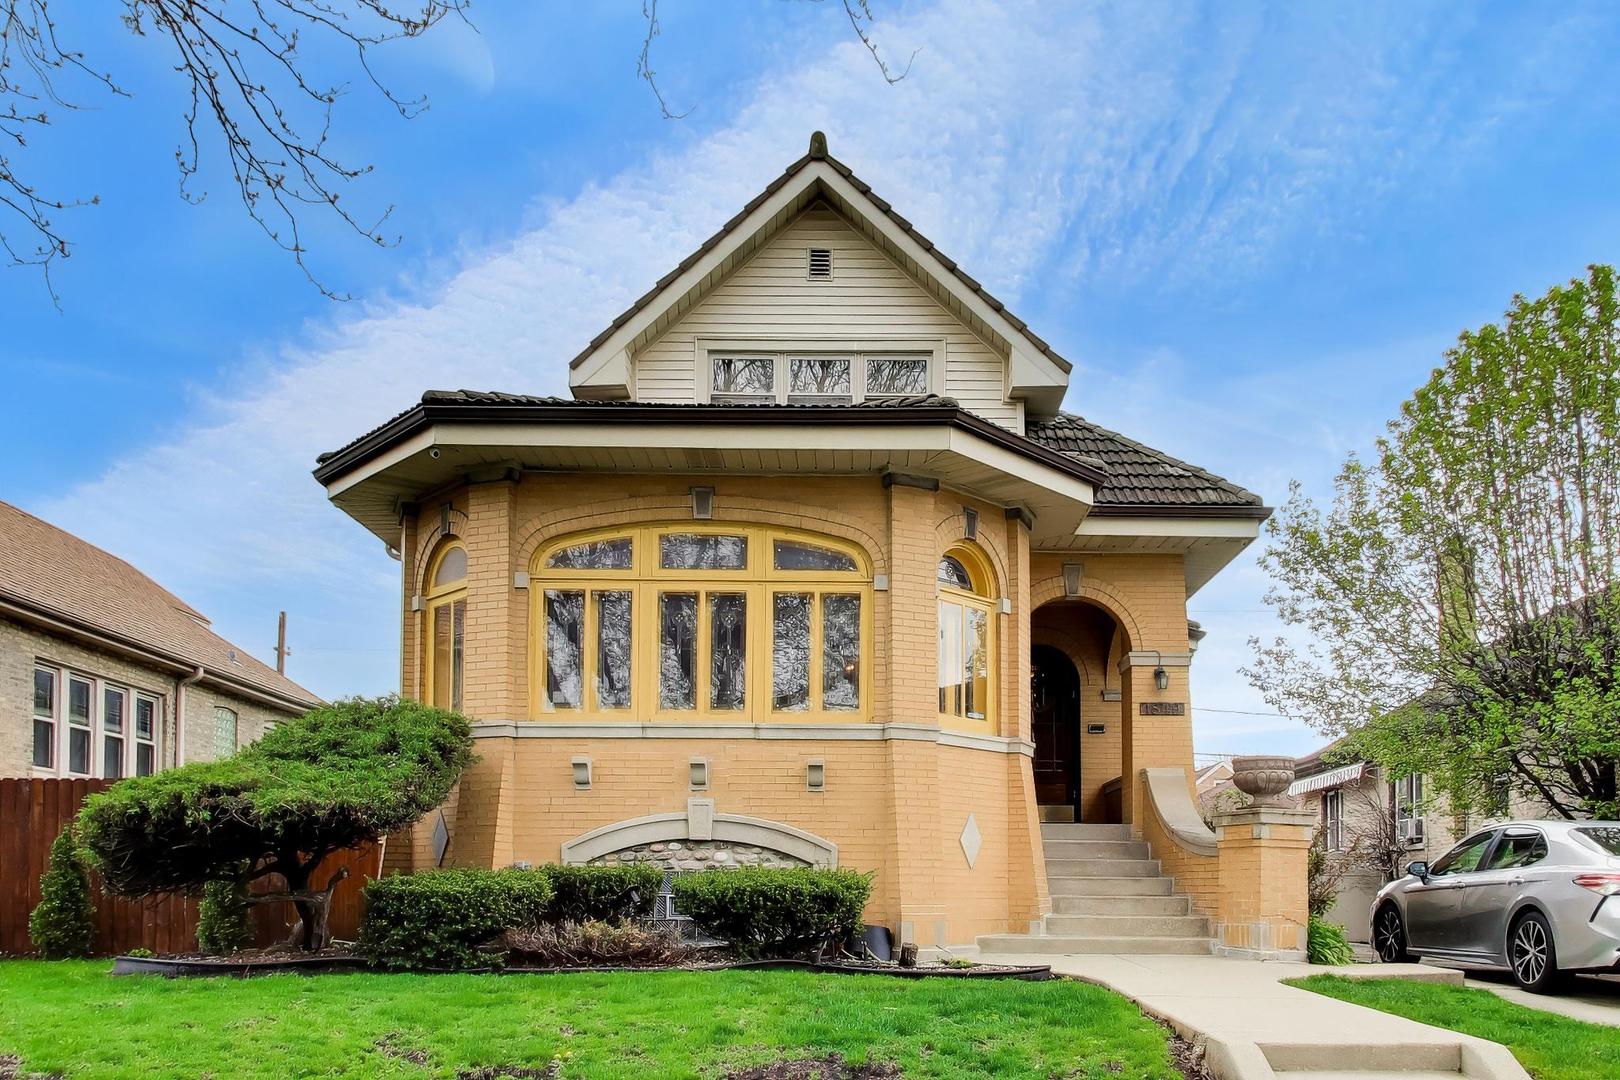
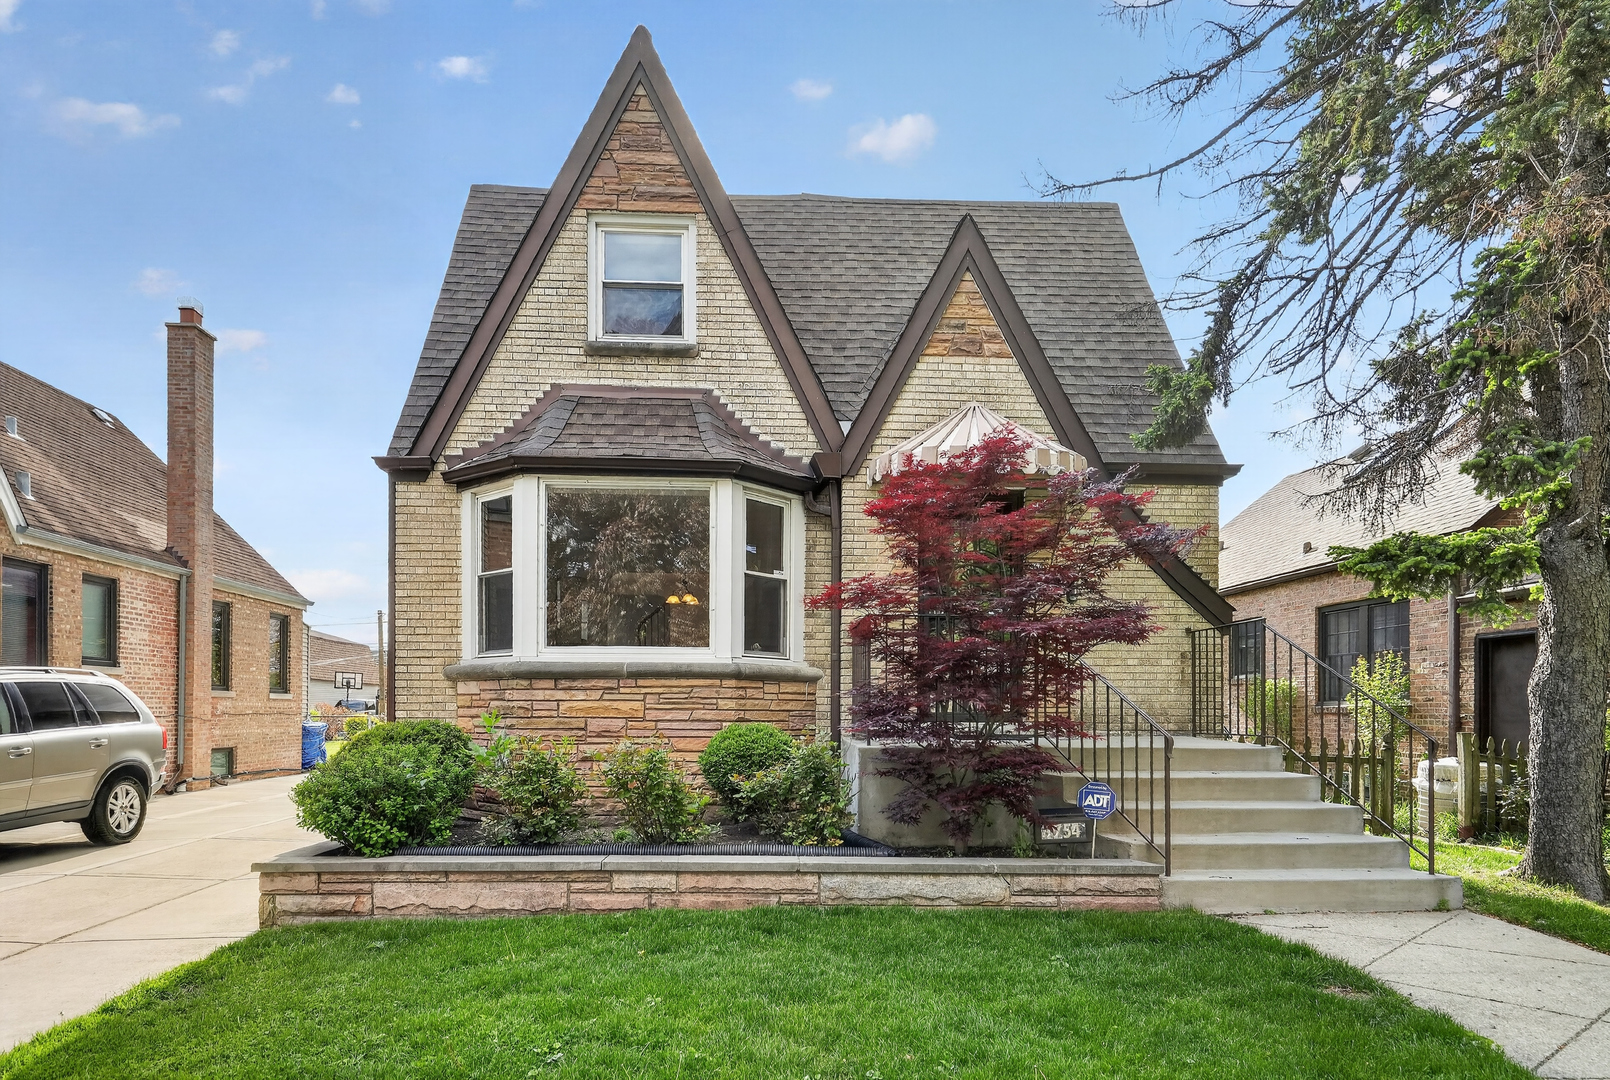
Located within the Austin community for its most part, Galewood is a neighborhood settled on the far Western edge of Chicago—approximately eight miles west of the Loop. Commercial and industrial activity on the neighborhood’s border does not make the area any less pleasant—Galewood is home to a variety of quiet, tree-lined home types and styles. The area’s extensive outdoor green space, parks, and friendly atmosphere give the community a suburban feel. It has friendly residents, is accessibility to public transport, a diverse population, and the parks make the neighborhood a coveted Chicago residential area.
10,348 people live in Galewood, where the median age is 43 and the average individual income is $48,377. Data provided by the U.S. Census Bureau.
Total Population
Median Age
Population Density Population Density This is the number of people per square mile in a neighborhood.
Average individual Income
There's plenty to do around Galewood, including shopping, dining, nightlife, parks, and more. Data provided by Walk Score and Yelp.
Explore popular things to do in the area, including Leo's Liquors Mayfair, Tas Eatery, and Pasta Rosa & Sandwiches.
| Name | Category | Distance | Reviews |
Ratings by
Yelp
|
|---|---|---|---|---|
| Dining | 4.58 miles | 12 reviews | 5/5 stars | |
| Dining | 2.09 miles | 5 reviews | 5/5 stars | |
| Dining | 4.82 miles | 5 reviews | 5/5 stars | |
| Dining | 4.92 miles | 11 reviews | 5/5 stars | |
| Dining | 4.38 miles | 12 reviews | 5/5 stars | |
| Dining | 2.31 miles | 5 reviews | 5/5 stars | |
| Shopping | 1.79 miles | 10 reviews | 5/5 stars | |
| Shopping | 1.94 miles | 7 reviews | 5/5 stars | |
| Shopping | 4.19 miles | 7 reviews | 5/5 stars | |
| Active | 4.29 miles | 13 reviews | 5/5 stars | |
| Active | 2.43 miles | 9 reviews | 5/5 stars | |
| Active | 0.6 miles | 11 reviews | 5/5 stars | |
| Active | 4.08 miles | 6 reviews | 5/5 stars | |
| Active | 1.83 miles | 16 reviews | 5/5 stars | |
| Active | 1.92 miles | 20 reviews | 5/5 stars | |
| Nightlife | 2.06 miles | 5 reviews | 5/5 stars | |
| Beauty | 3.59 miles | 7 reviews | 5/5 stars | |
| Beauty | 4.58 miles | 7 reviews | 5/5 stars | |
| Beauty | 1.44 miles | 5 reviews | 5/5 stars | |
| Beauty | 4.51 miles | 5 reviews | 5/5 stars | |
| Beauty | 1.72 miles | 5 reviews | 5/5 stars | |
| Beauty | 1.56 miles | 5 reviews | 5/5 stars | |
|
|
||||
|
|
||||
|
|
||||
|
|
||||
|
|
||||
|
|
Galewood has 3,997 households, with an average household size of 3. Data provided by the U.S. Census Bureau. Here’s what the people living in Galewood do for work — and how long it takes them to get there. Data provided by the U.S. Census Bureau. 10,348 people call Galewood home. The population density is 11,762.794 and the largest age group is Data provided by the U.S. Census Bureau.
Total Population
Population Density Population Density This is the number of people per square mile in a neighborhood.
Median Age
Men vs Women
Population by Age Group
0-9 Years
10-17 Years
18-24 Years
25-64 Years
65-74 Years
75+ Years
Education Level
Total Households
Average Household Size
Average individual Income
Households with Children
With Children:
Without Children:
Marital Status
Blue vs White Collar Workers
Blue Collar:
White Collar:
Experience a seamless real estate journey with expert guidance, tailored strategy, and white-glove service. Let’s achieve your goals—effortlessly.